Have you ever come across the notation “Z subscript alpha” (written as \( z_\alpha \)) and wondered what it really means? If you’re diving into statistics or hypothesis testing, understanding this term is crucial.
Simply put, \( z_\alpha \) represents a specific point on the standard normal distribution curve—a z-score that marks the cutoff where the area (or probability) to the right equals alpha (α). But why does this matter to you? Knowing what \( z_\alpha \) indicates can help you make sense of confidence intervals, significance levels, and whether to accept or reject a hypothesis.
Stick with me, and I’ll break down the concept clearly, so you can confidently navigate statistical results and apply them to your own analyses.
Z-score Basics
The Z-score is a key concept in statistics. It shows how far a data point is from the average. This distance is measured in standard deviations.
Z-scores help compare values from different data sets. They standardize scores so you can understand their relative positions.
What Is A Z-score?
A Z-score tells how many standard deviations a number is from the mean. A Z-score of 0 means the number is exactly average.
Positive Z-scores are above the mean. Negative Z-scores are below the mean.
How To Calculate A Z-score
The formula is simple: subtract the mean from the value. Then divide the result by the standard deviation.
This calculation shows how much the value differs from the average in units of standard deviation.
Why Use Z-scores?
Z-scores allow comparison across different data sets. They also help find probabilities and areas under the normal curve.
In hypothesis testing, Z-scores identify critical values that signal significant results.

Credit: homework.study.com
Role Of Alpha In Statistics
Alpha plays a key role in statistical testing. It sets the threshold for making decisions about data. This threshold is called the significance level.
Alpha defines the probability of rejecting a true null hypothesis. In other words, it measures the chance of making a Type I error. Common alpha values are 0.05, 0.01, or 0.10.
Using alpha helps to control how strict a test is. A smaller alpha means stricter criteria for rejecting the null hypothesis. This balance is important for valid conclusions.
What Alpha Represents In Hypothesis Testing
Alpha represents the cut-off point for significance. It is the maximum risk of error allowed in the test. If the p-value is less than alpha, the null hypothesis is rejected.
This decision helps identify if results are statistically significant. It shows whether findings are likely due to chance or a real effect. Alpha guides researchers in drawing conclusions.
How Alpha Relates To The Z Subscript Alpha Notation
The notation zα indicates a critical value on the normal distribution. It marks the boundary where the area to the right equals alpha. This value separates common from rare events.
This critical z-score is used to decide if a result falls in the rejection region. It helps test hypotheses by comparing sample data to this boundary. The smaller the alpha, the farther the critical z-score from zero.
Impact Of Alpha On Confidence Levels
Alpha is linked to confidence levels in interval estimation. Confidence level equals 1 minus alpha. For example, an alpha of 0.05 corresponds to a 95% confidence level.
This means the interval likely contains the true population parameter 95% of the time. Lower alpha values increase confidence but widen intervals. This trade-off is important in analysis.
Meaning Of Z Subscript Alpha
The notation zα holds a key role in statistics. It represents a specific point on the standard normal distribution curve. This point is tied to the probability or area in the curve’s tail.
Understanding zα helps interpret results from hypothesis tests and confidence intervals. It shows the cutoff value where the area to the right equals alpha (α). Alpha typically represents the significance level or the risk of error.
What Does The Subscript Α Represent?
The subscript α stands for a probability value. It identifies the area in the right tail of the normal distribution curve. This area equals the chance of observing a value beyond the corresponding z score.
For example, if α = 0.05, z0.05 marks the point where 5% of the curve lies to the right. This is critical in deciding if a test result is statistically significant.
zαThe z-score measures how far a data point is from the mean. It is expressed in standard deviations. The zα value is a specific z-score tied to the alpha level.
This score sets the boundary between common and rare events under the normal curve. Values beyond zα are unusual and less likely to occur by chance.
zα in Hypothesis TestingIn hypothesis testing, zα defines the rejection region. It helps decide if data supports rejecting the null hypothesis.
If the test statistic exceeds zα, results are significant at the α level. This means the observed effect is unlikely due to random chance.
Area Under The Curve
The notation Z subscript alpha (zₐ) marks the z-score with an area of alpha to its right under the curve. It shows the cutoff point in the standard normal distribution for that tail area. This helps find critical values in hypothesis testing.
The area under the curve refers to the total space beneath a probability distribution graph. It represents probabilities or proportions for values within a range. In the standard normal distribution, this curve is bell-shaped and symmetrical.
The notation zα marks a specific point on the horizontal axis. This point divides the curve so that the area to the right equals α, a small probability value. The area to the left equals 1 minus α.
Understanding The Right Tail Area
The value α represents the probability in the right tail of the curve. The right tail shows extreme values greater than zα. This area helps in setting cutoff points for tests or confidence intervals.
For example, if α = 0.05, z0.05 is the z-score where 5% of the area lies to the right. This value helps find critical boundaries in statistics.
Role In Hypothesis Testing
The area under the curve connects to hypothesis testing. It shows the rejection region for a test statistic. If a test result falls beyond zα, the null hypothesis may be rejected.
This approach ensures decisions are based on probability limits. The area α controls the risk of wrong rejection, known as Type I error.
Calculating The Area Using Z-scores
Z-scores measure how far a point is from the mean in standard deviations. The point zα corresponds to a z-score matching area α to its right. Tables and software help find these z-scores easily.
Knowing zα allows calculation of probabilities for values above that score. This guides many practical problems in statistics and data analysis.
Critical Values In Hypothesis Testing
Critical values play a key role in hypothesis testing. They help decide if the test result is significant or not. These values mark the boundary between accepting or rejecting the null hypothesis.
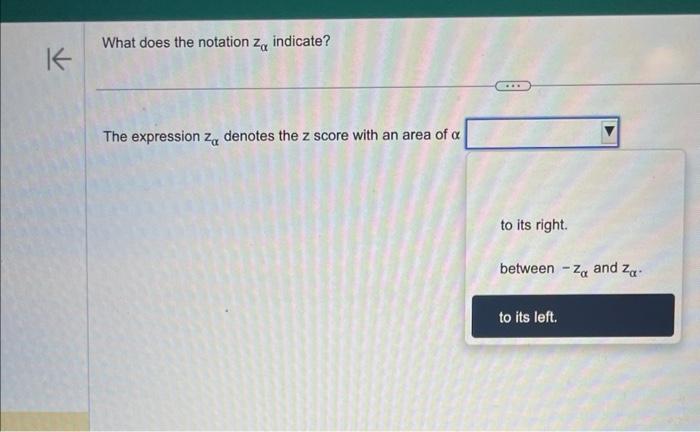
The notation zα represents a critical value on the standard normal distribution curve. It shows the z-score where the area to its right equals α, the significance level.
Definition Of Critical Values
Critical values are cutoff points in a probability distribution. They separate the region of acceptance from the rejection region. If the test statistic passes this value, the null hypothesis is rejected.
Role ofzα in Hypothesis TestingThe zα value identifies the threshold for rejecting the null hypothesis. It depends on the chosen significance level α, such as 0.05 or 0.01. This value corresponds to the point where the tail area equals α.
zα ValuesDuring testing, calculate the test statistic from your sample data. Compare this statistic to zα. If the statistic is greater than zα, reject the null hypothesis. Otherwise, do not reject it.
Examples Of Common Critical Values
For a 5% significance level in a right-tailed test, z0.05 is about 1.645. For 1%, z0.01 is approximately 2.33. These values come from standard normal distribution tables.
Credit: www.chegg.com
Significance Level And Alpha
The significance level, often called alpha (α), plays a key role in statistics. It defines the threshold for rejecting a null hypothesis. This value helps decide whether the results are due to chance or represent a real effect.
Alpha typically ranges from 0.01 to 0.10 in studies. The smaller the alpha, the stricter the test. For example, an alpha of 0.05 means there is a 5% chance of rejecting a true null hypothesis.
What Is Significance Level?
Significance level is the probability of making a Type I error. This error occurs when the null hypothesis is wrongly rejected. Researchers set this level before testing to control risk.
A common significance level is 0.05. It means a 5% risk of false positive results. This level balances error risk and test sensitivity.
How Alpha Relates to ZαThe notation Zα refers to a critical z-score. This score marks the boundary of the rejection region in a normal distribution. It corresponds to the area α in the right tail.
For example, if α = 0.05, Z0.05 is the z-score with 5% of the area to its right. Values beyond this z-score indicate statistically significant results.
Using Alpha In Hypothesis Testing
In hypothesis testing, alpha sets the cut-off for significance. If the test statistic exceeds Zα, reject the null hypothesis. Otherwise, do not reject it.
This method helps avoid false claims. It ensures findings are reliable under the chosen risk level. Alpha guides decisions based on data evidence.
Calculating Z Alpha Values
Calculating Z alpha values is essential in statistics for finding critical points. These points mark the boundaries for rejection regions in hypothesis tests. The notation zα represents the z-score where the area to its right equals α. This area corresponds to the significance level in many tests.
Understanding how to calculate these values helps interpret results correctly. It also supports decisions about accepting or rejecting hypotheses. Let’s explore the process in simple steps.
What Is Z Alpha In Statistics?
The zα value comes from the standard normal distribution. It is the point on the z-axis with α area to the right. For example, if α = 0.05, then z0.05 is the z-score with 5% area to the right.
This value helps set thresholds in tests like confidence intervals and hypothesis testing.
Using Z Tables To Find Z Alpha
Z tables list z-scores and their cumulative areas from the left. To find zα, first calculate 1 – α. Then locate this area in the table.
The corresponding z-score is the zα value. For example, if α = 0.05, find 0.95 in the table and read the z-score.
Calculating Z Alpha With Statistical Software
Statistical software and calculators can find zα quickly. Input the significance level α, and the tool returns the z-score.
This method is fast and reduces errors. It works well for precise calculations or unusual α values.
Examples Of Z Alpha Values
Common α values include 0.10, 0.05, and 0.01. Their zα values are approximately 1.28, 1.645, and 2.33 respectively.
These numbers appear often in confidence intervals and hypothesis testing tables.
Credit: www.chegg.com
Z Alpha In Confidence Intervals
The notation Zα plays a key role in confidence intervals. It represents a specific point on the standard normal distribution curve. This point helps define the range where the true population parameter likely lies. Understanding Zα is essential for interpreting confidence intervals correctly.
Confidence intervals estimate an unknown population parameter. They use sample data to create a range with a certain confidence level. The value of Zα determines how wide or narrow this range is.
Z Alpha And The Confidence Level
The confidence level shows how sure we are about the interval. Common levels are 90%, 95%, and 99%. The value α equals 1 minus the confidence level. For example, for a 95% confidence level, α = 0.05. The subscript α in Zα relates to this value.
How Z Alpha Defines The Margin Of Error
The margin of error depends on Zα/2. This value is the z-score that cuts off the top α/2 area of the curve. It marks the critical boundary for the confidence interval. Larger Zα/2 values mean wider intervals and more certainty.
Finding Z Alpha Values On The Standard Normal Curve
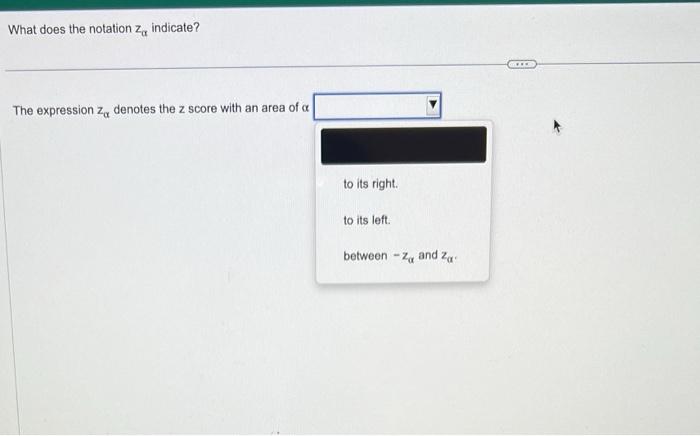
The standard normal curve has a mean of zero and a standard deviation of one. Zα is the z-score with an area of α to its right. Tables or software tools help find this z-score. For example, Z0.05 ≈ 1.645, meaning 5% of the area lies to the right.
Type I Error And Z Alpha
Type I error and Z alpha play a key role in hypothesis testing. Type I error occurs when we reject a true null hypothesis. This means we think there is an effect when there is none.
Z alpha, written as zα, marks the cutoff point on the standard normal curve. It shows the boundary for rejecting the null hypothesis at a certain significance level, α.
What Is Type I Error?
Type I error is the risk of a false positive result. It happens when the test wrongly signals a significant effect. The probability of this error is the significance level, α.
For example, if α = 0.05, there is a 5% chance of making a Type I error. Researchers set this level before testing to control error chances.
The Role Of Z Alpha
Z alpha is the critical z-score that corresponds to the significance level α. It divides the normal distribution into acceptance and rejection regions.
This z-score shows the point where the area to the right equals α. It helps decide if the test statistic is extreme enough to reject the null hypothesis.
How Z Alpha Relates To Type I Error
The area beyond zα equals the probability of Type I error. If the test statistic is greater than zα, we reject the null hypothesis.
Thus, zα acts as a threshold. It controls how often we accept false positives in hypothesis testing.
Practical Examples Of Z Alpha
The notation zα is vital in statistics. It represents a specific point on the standard normal distribution curve. This point divides the curve so that the area to the right equals alpha (α). Alpha usually denotes the level of significance in hypothesis testing.
Understanding practical examples helps clarify this concept. It shows how zα applies in real-world scenarios. Below are some clear examples.
Example 1: Finding Critical Values For Hypothesis Testing
Suppose a test uses a 5% significance level. Here, α = 0.05. The critical value z0.05 marks the point where 5% of the curve lies to the right. This value is about 1.645. If a test statistic exceeds 1.645, it falls in the rejection region.
Example 2: Setting Confidence Intervals
For a 95% confidence level, α equals 0.05. The value z0.025 is used because the 5% is split between two tails (2.5% each). This critical z-value is approximately 1.96. It helps create the range where the true population parameter likely lies.
Example 3: Quality Control In Manufacturing
In quality control, zα helps set tolerance limits. For example, a company may accept 1% defect rate. The corresponding z-value z0.01 is around 2.33. Products beyond this z-score are rejected as defects.
Frequently Asked Questions
What Does Z Sub Alpha Mean?
Z sub alpha (zₐ) represents the z-score with an area of alpha (α) to its right under the standard normal curve.
What Is The Expression Z Subscript Alpha Denotes The Z-score With An Area Of Alpha?
The expression \( z_{\alpha} \) denotes the z-score with an area of \(\alpha\) to its right under the standard normal curve. It serves as a critical value in hypothesis testing.
What Does A Critical Value Z Subscript Alpha Denotes?
A critical value \( z_{\alpha} \) denotes the z-score with area \(\alpha\) to its right under the standard normal curve. It marks the rejection boundary in hypothesis testing at significance level \(\alpha\).
What Does Z Represent In Confidence Intervals?
Z represents the z-score, indicating how many standard deviations a value is from the mean in confidence intervals. It defines the critical value marking the confidence level’s boundary under the standard normal distribution.
What Does The Notation Z Subscript Alpha Mean?
Z subscript alpha (zα) is the z-score with an area of alpha to its right under the normal curve.
How Is Z Subscript Alpha Used In Statistics?
It helps find critical values for hypothesis testing and confidence intervals in the standard normal distribution.
What Does The Area Alpha Represent In Z Subscript Alpha?
Alpha represents the probability or area in the right tail beyond the zα value.
Why Is Z Subscript Alpha Important In Hypothesis Testing?
It marks the boundary for rejecting the null hypothesis at a given significance level.
How Do You Interpret The Value Of Z Subscript Alpha?
It shows how many standard deviations a point is from the mean, cutting off area alpha to the right.
Is Z Subscript Alpha Always Positive Or Negative?
Z subscript alpha is usually positive, marking the right tail area; negative values mark the left tail.
Conclusion
The notation \( z_\alpha \) represents a specific z-score in statistics. It marks the point on the standard normal curve with area \(\alpha\) to its right. This value helps identify critical regions in hypothesis testing. Understanding \( z_\alpha \) aids in determining confidence intervals and significance levels.
It simplifies decision-making in statistical analysis. Remember, \( z_\alpha \) connects probabilities to standard deviations. Keeping this concept clear supports better interpretation of data results.